
How to Configure and Use Smart Analytics in Hyper PWA
Smart Analytics is a premium feature of Hyper PWA. To use this feature, you must upgrade your plugin to the Premium plan.
👉 Upgrade to Premium Plan
To deliver a successful application experience, it is vital to know how your audience interacts with it. Smart Analytics lets you track installation milestones, views, and visitor actions in real-time, directly from your WordPress dashboard.
⚙️ How to Configure Smart Analytics
After activating Hyper PWA Premium, go to your WordPress sidebar, navigate to Hyper PWA > Premium Features, and open the Smart Analytics settings section.
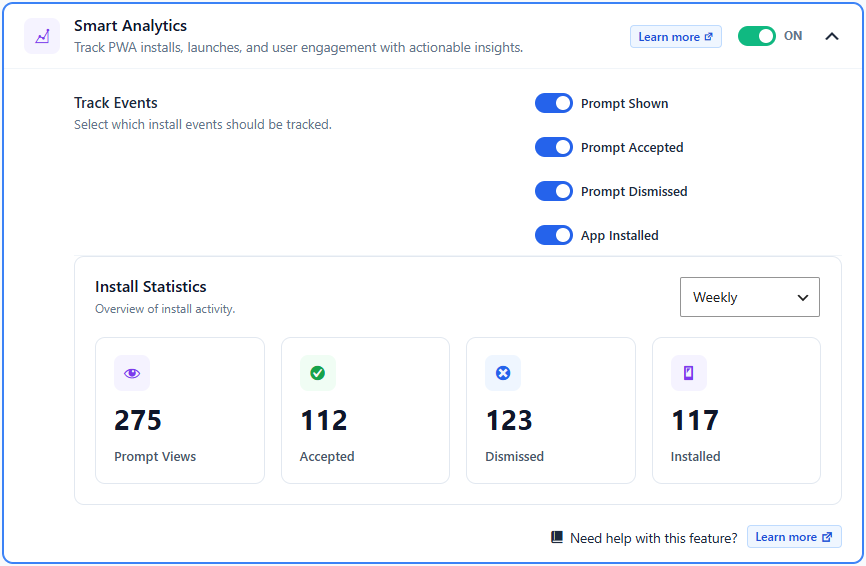
Step 1: Enable Analytics Tracking
Toggle the main Smart Analytics switch to ON. This loads the tracking scripts in your visitors’ browser background once the service worker activates.
Step 2: Configure Your Tracked Events
Under the Track Events section, check or uncheck individual checkboxes depending on which actions you want to save to your database:
- Prompt Shown: Logs an event whenever the custom install prompt is presented to a visitor.
- Prompt Accepted: Logs an event when a user clicks the “Install” call-to-action button inside your custom prompt.
- Prompt Dismissed: Logs an event when a user closes or dismisses your custom installation banner.
- App Installed: Logs an event when the PWA is successfully saved and installed onto the user’s home screen.
Step 3: View Install Statistics
The dashboard displays a structured Install Statistics summary panel with four key metrics:
- Prompt Views: The total number of times your custom install prompt was viewed by visitors.
- Accepted: How many times visitors accepted the prompt to initiate installation.
- Dismissed: How many times the prompt was closed or swiped away.
- Installed: The number of successful app installations completed on visitor devices.
Step 4: Filter Data by Period
Use the dropdown selection menu in the top-right corner of the statistics card to change the time range. You can filter your overview metrics by:
- Daily (Current 24-hour cycle)
- Weekly (Last 7 days)
- Monthly (Current calendar month)
- Yearly (Current calendar year)